I’ve made effort to track my expenses over the last few years. This meant keeping a record every time I took money or a credit card out of my wallet. It is a tedious process, and gets sloppy at times.
At the beginning of this year I set out to track my finances a little differently; I started tracking my total net worth month-to-month. Tracking net worth is much easier than tracking expenses because you only need to do it once a month. The difference, however, is that tracking net worth does not give you visibility into where exactly money is spent, e.g. food, entertainment, transport, etc.
This is how I do it: At every start of the month, after I get my salary but before I pay my credit card bills, I keep a record of the following in an excel sheet: –
- Net present value of resident property less outstanding loan
- Net present value of investment property less outstanding loan
- Net present value of other assets (e.g. cars) less outstanding loan
- Net present value of other liquid investments, e.g. stocks, bonds, endowment, etc.
- Net present value of any high value personal items, e.g. jewelry
- Outstanding credit card debts, or other unsecured credit facilities (if any)
- Total cash in bank
- Total balance in CPF account
* For illiquid assets, e.g. cars and jewelry, apply a fair discount of between 10-30% to its NPV.
Then, I would create three different totals: –
- Total of 1-8 (everything)
- Total of 1-7 (everything except CPF)
- Total of 2-7 (everything except CPF and resident property)
The reason for breaking up three totals is because I do not consider CPF and residence as liquid. This will give me a good idea if I am cash rich or (illiquid) asset rich.
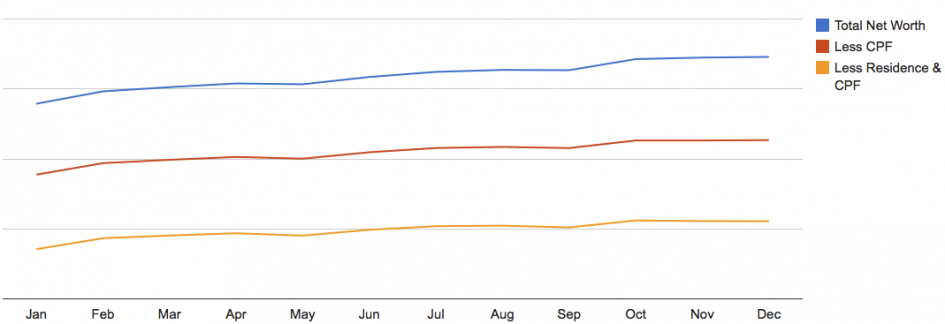
Over a one year period, a graph like this is promising.
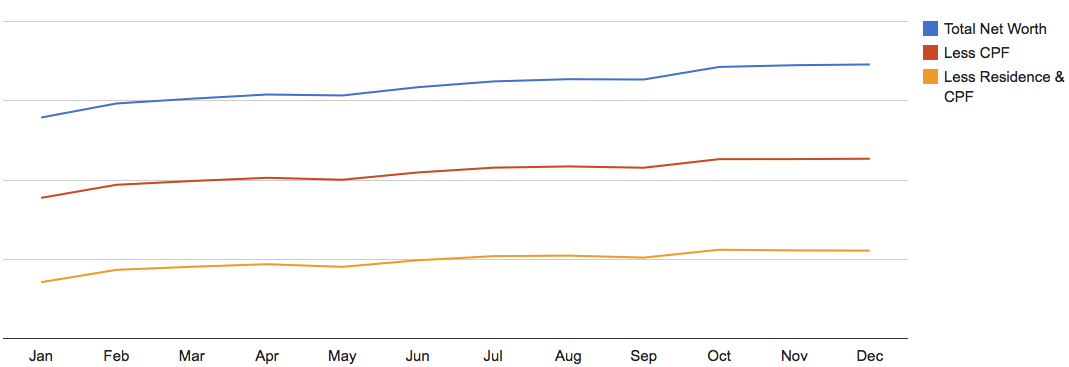
There’s two things to note: –
- The general trend of the graphs. If they trend upwards, I am making good progress, i.e. earning more than I spend. If they trend downwards, I am in trouble.
- The gap between the yellow and blue lines. If this gap widens a lot, and especially if the blue line trends upwards while the yellow line starts to trend downwards, it means I may be spending too much on a potentially illiquid asset (residence) and should do something about it.
Remember an article in The Straits Times about Singaporeans being asset rich and cash poor? I think the missing point here is that the problem only arises if the asset is illiquid. If the asset is liquid, it wouldn’t be a problem, e.g. a retiree could sell an investment property to fund his retirement.
For those who have investments and assets, it is a good idea to start tracking your net worth to see if your asset is indeed an asset or liability. If done correctly, you should see vehicles losing value while your properties gaining value month-on-month.
But if you have not even started tracking your expenses, you should start doing so before tracking your net worth, because detailed expense tracking will help you see where money is going so you can trim unnecessary areas of high expenditure, e.g. shopping.
With that, I wish all my readers a happy, healthy and prosperous 2015!